
 Indicator for Market Analysis")
Rate of Change Indicator and Its Role in Market Analysis
The Rate of Change (ROC) indicator is a momentum oscillator that measures the percentage change in price over a specific period. It helps traders identify trends, strength of momentum, and potential reversals in the market. Unlike lagging indicators, ROC reacts quickly to price movements, making it particularly useful in volatile trading environments.
This indicator oscillates around a zero line:
- Positive values indicate upward momentum.
- Negative values suggest declining momentum.
- Extreme values may signal overbought or oversold conditions.
ROC is widely used in forex, stocks, and cryptocurrency trading to confirm trends and anticipate market shifts before they fully develop.
Understanding Momentum and Trend Strength
Momentum reflects the speed at which prices change. ROC quantifies this by comparing the current price to a past price from a set number of periods ago. A steeply rising ROC suggests strong bullish momentum, while a declining ROC signals weakening market strength.
ROC also helps distinguish between healthy trends and exhaustion phases:
- A gradual increase or decrease in ROC suggests a sustainable trend.
- A sharp spike followed by a quick reversal may indicate a short-term price surge with low sustainability.
Why Traders Use ROC in Volatile Markets
Markets with high volatility, such as cryptocurrencies and emerging stocks, often experience rapid price movements. ROC provides a way to measure these shifts and anticipate potential breakouts or reversals.
For example, during Bitcoin’s 2021 bull run, the ROC indicator spiked significantly before price corrections. Traders who recognized these signals were able to adjust positions before the market turned.
How to Calculate Rate of Change Indicator
The ROC formula is straightforward, making it easy for traders to apply across different assets:
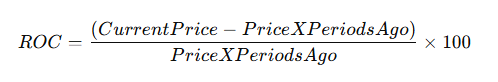
The default period setting is 9 or 14, but this can be adjusted based on trading style. Shorter periods make ROC more sensitive, while longer periods smooth out price fluctuations.
Formula Breakdown and Example Calculation
Let’s assume:
- Current price = $150
- Price 10 periods ago = $130
Using the formula:
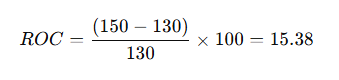
A positive ROC of 15.38 suggests strong momentum, signaling a potential uptrend.
Adjusting ROC Periods for Different Trading Styles
Traders adjust ROC periods based on their approach:
- Short-term traders (scalpers & day traders): Use 5-10 periods for quicker signals.
- Swing traders: Prefer 14-21 periods to capture broader price movements.
- Long-term investors: Use 50+ periods to filter out market noise.
For instance, a forex trader using a 5-period ROC may see frequent shifts in momentum, allowing them to capitalize on short-term reversals, while an equity investor using a 20-period ROC would focus on more stable trend formations.
Interpreting Rate of Change Indicator in Trading
ROC provides insights into price momentum, helping traders confirm trends, detect reversals, and gauge market conditions.
Identifying Trend Direction and Strength
- ROC above zero: Prices are rising, indicating a bullish trend.
- ROC below zero: Prices are declining, signaling a bearish trend.
- ROC crossing the zero line: A potential shift in trend direction.
For example, if a stock’s ROC moves from -5 to +8, it suggests increasing buying pressure and a potential breakout. Conversely, a drop from +12 to -4 could warn of a reversal.
Recognizing Momentum Shifts with ROC Values
Momentum traders use ROC to measure the intensity of price moves:
- High absolute ROC values (>10 or <-10): Indicate strong momentum.
- Low absolute ROC values (close to 0): Suggest weak momentum or sideways movement.
Divergences between ROC and price action can also signal reversals. If a stock is making higher highs but ROC is declining, it may indicate weakening momentum before a downturn.
Using Rate of Change for Trend Identification
The Rate of Change (ROC) indicator helps traders identify market trends by measuring momentum. Unlike moving averages, which smooth price action, ROC reacts quickly to shifts, making it useful for detecting early trend changes.
A rising ROC suggests increasing buying pressure, while a declining ROC signals growing selling pressure. When ROC hovers near zero, it often indicates sideways movement with no strong trend direction.
Positive vs. Negative ROC and Market Trends
- Positive ROC values indicate an upward trend, meaning the asset is gaining momentum. The higher the value, the stronger the bullish pressure.
- Negative ROC values suggest a downtrend, as prices are falling relative to the past period. A steep decline may signal strong bearish momentum.
- Zero-line crossovers often hint at trend reversals. When ROC moves from negative to positive, it may signal the start of a new uptrend, whereas a shift from positive to negative suggests a bearish transition.
For example, during the 2023 S&P 500 rally, ROC consistently remained positive, confirming the strength of the uptrend. When it dipped below zero, it signaled a cooling phase before another leg up.
Combining ROC with Moving Averages for Confirmation
While ROC is effective on its own, combining it with moving averages enhances accuracy:
- A positive ROC above a rising moving average strengthens the bullish case.
- A negative ROC below a falling moving average confirms a bearish trend.
- If ROC diverges from the moving average direction, it may warn of a potential reversal.
Traders often use the 50-day or 200-day moving average with ROC to validate signals before making trading decisions.
Detecting Overbought and Oversold Conditions with ROC
ROC is also used to identify extreme market conditions. When the indicator reaches unusually high or low values, it may suggest that the asset is overbought or oversold, increasing the likelihood of a reversal.
How Extreme ROC Values Signal Reversals
- ROC above +10 or +15 is often seen as an overbought condition, meaning prices have risen too quickly and may pull back.
- ROC below -10 or -15 signals an oversold market, suggesting potential for a rebound.
For instance, during Bitcoin’s 2021 surge, ROC spiked above +20 before prices corrected. Traders who recognized the extreme ROC value prepared for a potential downturn.
Setting Overbought and Oversold Thresholds Based on Market Volatility
Different assets and timeframes require customized ROC thresholds:
| Market Type | Overbought ROC Level | Oversold ROC Level |
| Forex (Major Pairs) | ±10 | ±10 |
| Stocks (Blue-Chip) | ±15 | ±15 |
| Cryptocurrencies | ±20 | ±20 |
A trader using ROC for forex trading might set overbought at +10, whereas a crypto trader may wait for +20 to confirm an extreme reading.
Rate of Change Divergence as a Trading Signal
ROC divergence occurs when price action moves in one direction, but ROC moves in the opposite, signaling a weakening trend.
Spotting Bullish and Bearish Divergences
- Bullish divergence: Price makes lower lows, but ROC makes higher lows, suggesting a weakening downtrend and potential reversal.
- Bearish divergence: Price makes higher highs, but ROC forms lower highs, indicating that momentum is fading and a downturn could follow.
For example, in early 2022, Tesla stock showed bearish divergence—prices climbed to record highs, but ROC declined. Soon after, the stock reversed sharply downward.
How ROC Divergence Predicts Market Reversals
Divergences act as early warning signs:
- If ROC diverges from price, traders look for additional confirmation (e.g., candlestick patterns, support/resistance levels).
- A sudden increase in volume alongside divergence strengthens the reversal signal.
- Combining ROC divergence with other indicators like RSI or MACD can improve accuracy.
Understanding ROC divergence helps traders anticipate market shifts before they occur, giving them an edge in volatile conditions.
Zero Line Crossovers and Trading Implications
The zero line in the Rate of Change (ROC) indicator serves as a critical reference point for identifying potential trend shifts. When ROC crosses above or below this line, it often signals a change in momentum, providing traders with entry and exit opportunities.
Unlike oscillators that have defined overbought and oversold levels, ROC’s zero line crossover acts as a trend confirmation tool. While a crossover does not guarantee an immediate price move, it adds weight when combined with other technical indicators like moving averages or support and resistance levels.
Bullish Signals When ROC Crosses Above Zero
When ROC moves from negative to positive, it suggests that the asset’s price is gaining upward momentum. This bullish signal may indicate:
- A strengthening uptrend: Buyers are gaining control, pushing prices higher.
- Confirmation of a breakout: If ROC rises above zero following a period of consolidation, it supports a bullish breakout.
- Potential long entry points: Many traders use the crossover as a signal to open long positions, particularly when supported by increasing volume.
For example, in early 2023, the S&P 500’s ROC moved above zero after months of sideways movement, aligning with a rally that lasted several months.
Bearish Trends When ROC Falls Below Zero
When ROC crosses below zero, it indicates weakening momentum and a possible shift to a downtrend. This bearish signal often points to:
- A declining trend: Sellers are in control, leading to falling prices.
- Breakdown confirmation: If ROC drops below zero after a failed breakout, it strengthens bearish sentiment.
- Shorting opportunities: Traders often use this signal to enter short positions, particularly in conjunction with resistance levels.
During the 2022 tech stock sell-off, many stocks showed ROC dropping below zero, confirming sustained downward trends across the sector.
Trading Strategies with Rate of Change Indicator
ROC is a flexible tool that can be applied to various trading strategies. Traders use it for trend following, mean reversion, and divergence-based trading to identify profitable opportunities.
Trend Following with ROC Confirmation
Trend-following strategies rely on identifying and capitalizing on strong market trends. ROC helps confirm trend direction by staying above zero in bullish phases and below zero in bearish ones.
Key components of using ROC for trend following:
- Enter long positions when ROC is positive and rising, signaling increasing bullish momentum.
- Stay in the trade as long as ROC remains above zero, confirming trend strength.
- Exit or reverse positions when ROC falls below zero, indicating momentum loss.
Pairing ROC with moving averages (e.g., the 50-day MA) enhances reliability. If ROC is positive while the price is above a rising moving average, the trend-following signal is stronger.
Mean Reversion Strategy Based on Extreme ROC Values
In range-bound markets, traders often use ROC for mean reversion strategies, identifying overextended price movements that are likely to revert.
How it works:
- Identify extreme ROC readings (e.g., above +10 or below -10, depending on the asset).
- Look for reversal confirmation through candlestick patterns or support/resistance levels.
- Enter counter-trend trades, expecting the price to revert to its average.
For example, when Apple stock’s ROC hit +15 in late 2021, traders anticipated a pullback, which occurred as the stock corrected by 8% in the following weeks.
Divergence Trading for Anticipating Reversals
Divergence between ROC and price movement often signals upcoming trend reversals.
- Bullish divergence: Price makes lower lows, but ROC makes higher lows—indicating weakening selling pressure.
- Bearish divergence: Price makes higher highs, but ROC makes lower highs—signaling weakening buying pressure.
Divergence is most effective when combined with other indicators like RSI or MACD. For instance, before the 2020 stock market crash, many indices displayed bearish divergence on ROC, warning of the upcoming downturn.
By integrating ROC into a well-rounded trading strategy, traders can enhance decision-making and identify profitable opportunities with greater confidence